1
WISCONSIN DEPARTMENT OF NATURAL RESOURCES
Fishery Survey Report for the Brill River,
Barron County, Wisconsin 2023
WATERBODY IDENTIFICATION CODE: 2106500
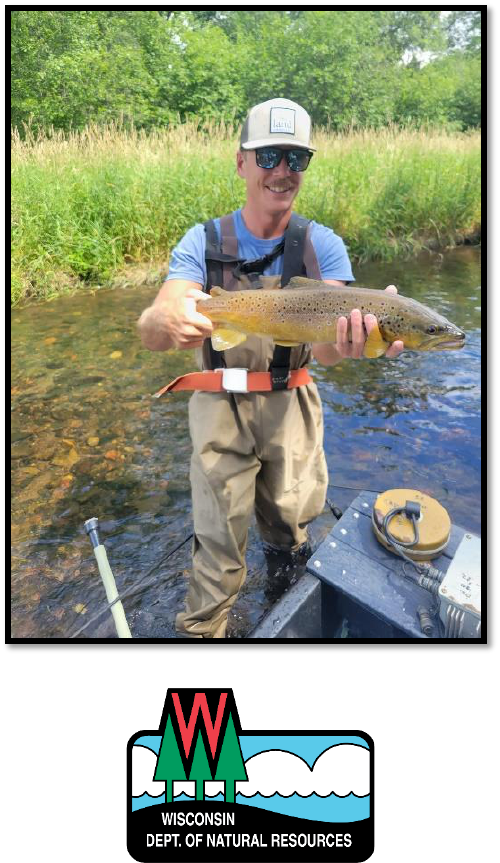
Photo Credit: Craig Landes
Kyle J. Broadway
DNR Fisheries Biologist-Senior
Brandon J. Wagester
DNR Fisheries Technician-LTE
2024
2
Introduction
The Brill River is a tributary to the Red Cedar River and is located in northeast Barron
County. The Brill River originates as the outflow of Long Lake in Washburn County and
flows into the Red Cedar River upstream of Rice Lake. The stream is 4.6 miles in
length and has approximately 3 miles of Class II trout water from the
Barron/Washburn County line downstream to 26
th
Avenue, near the unincorporated
community of Brill. Water temperatures are marginal for trout, and high water
temperatures likely limit the fishery. The watershed is largely composed of forested
and row-crop agricultural land, with some grassland to a lesser extent.
Brown trout are the predominant trout species in the Brill River, but brook trout are
also present. Brown trout were stocked annually from 1972 to 2022 by the Wisconsin
Department of Natural Resources (DNR). St. Croix strain yearlings and large fingerings
were stocked from 1992 – 2003 and Timber Coulee, the southwest feral strain, large
fingerlings were stocked from 2005 – 2022 (Appendix Table 1). Brown trout stocking
occurred during late September or early October each fall. Natural recruitment of
brown trout has been evident, and to further assess the contribution of natural
recruits to the adult population, stocking was discontinued following 2022.
The trout fishing season in Wisconsin opens the first Saturday in May and closes Oct.
15. There are no gear restrictions for the Brill River, but a special fishing regulation
occurs with a daily bag limit and length limit of two trout over 12 inches.
Methods
One station located at 27 1/2 Avenue was sampled on July 26, 2023. This site serves as
a fisheries assessment trout trend site and has been sampled annually since 2007.
Sampling occurred upstream along a 0.19 mile transect, which was determined by
multiplying the mean stream width by 35. Sampling was conducted using a barge
stream electrofishing unit with three electrodes and dip netters. All trout were
identified to species, measured to the nearest 0.1 inch and immediately released
following completion of the transect. Catch per unit effort (CPUE; index of relative
abundance) was estimated as catch per mile. The CPUE of each trout species was
compared to previous surveys and species-specific averages for Barron and Polk
counties. Size structure was assessed using the proportional size distribution (PSD)
indices (Neumann et al. 2013). The PSD value for a species is the number of fish of a
specified length or longer divided by the number of fish of stock length or longer, the
result multiplied by 100.
Habitat was not evaluated during this survey. Anecdotally, the Brill River flows
through mostly grassland and forested areas with little development. The river is
relatively shallow with predominantly riffle habitat and only a few deeper holes.
Overhanging grass along the streambanks is the primary habitat feature as very little
woody habitat is present. Substrates consisted of gravel and cobble with faster flows
3
and transitions to predominately sand with increasing aquatic vegetation and slower
flow near the end of the transect.
Results
BROWN TROUT
There were 129 brown trout collected during 2023 with a CPUE of 558 fish/mile. Brown
trout CPUE was well above the historical average (408 ± 29 fish/mile; standard error;
2007 - 2023) and the Barron and Polk counties mean CPUE (201 ± 67 fish/mile;
standard error; indexed using 39 survey sites across 22 streams within the past
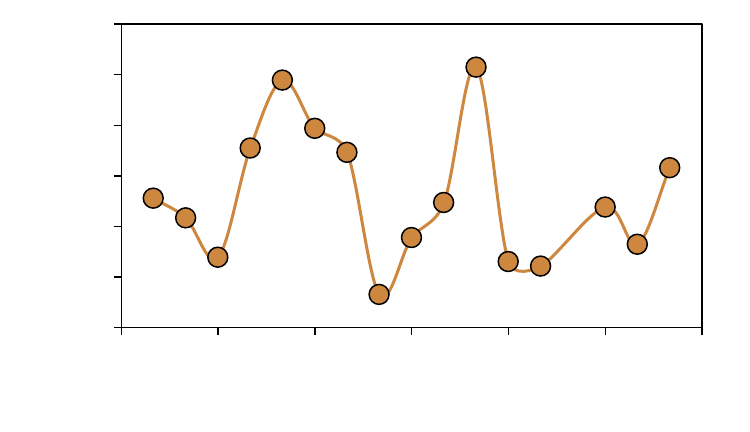
decade). The CPUE of brown trout ≥ 6 inches (index of adult abundance) was 316
fish/mile, which was greater than the historical mean (260 ± 82 fish/mile; standard
deviation) but remained stable through time with a high inter-annual variation. (P >
0.05; simple linear regression; Figure 1).
Figure 1. CPUE of brown trout ≥ 6 inches sampled from the Brill River, Barron County, Wis. during 2007 -
2023.
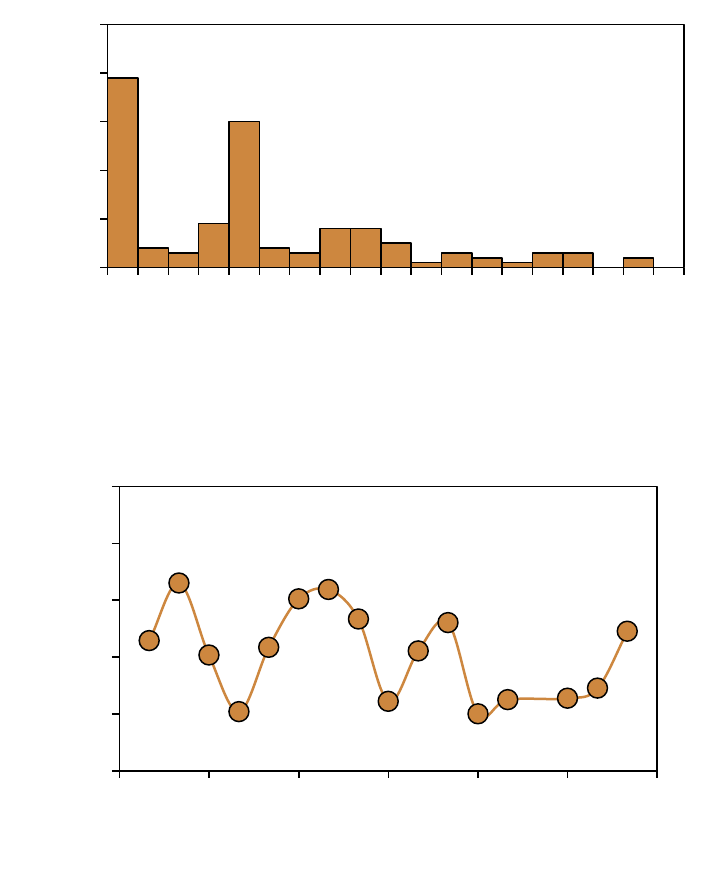
The size structure of the brown trout population remained good, with 10% of the
population greater than 15 inches (Figure 2). Brown trout ranged in length from < 3
inches to 19.0 inches with all length bins represented, which suggested multiple age
classes were present (Figure 2). The PSD-9 was 49, which was slightly above the
historical average but within the degree of inter-annual variation (PSD-9 = 41 ± 16;
standard deviation; Figure 3). The PSD-12 = 23, PSD-15 = 15 and PSD-18 = 3. Population
size structure remained stable through time with a high degree of inter-annual
variation (Figure 3).
0
100
200
300
400
500
600
2006 2009 2012 2015 2018 2021 2024
CPUE
Year
4
Figure 2. Length frequency histogram of brown trout sampled from the Brill River, Barron County, Wis.
during 2023.
Figure 3. PSD-9 of brown trout sampled from the Brill River, Barron County, Wis. during 2007 - 2023.
A good naturally recruited brown trout year class occurred during 2023. Most brown
trout sampled were < 3 inches in length and represented young-of-year (YOY) fish
(Figure 2). Large fingerling brown trout are stocked in the fall (September or October),
so YOY fish sampled during the summer were presumed to be natural recruits. The
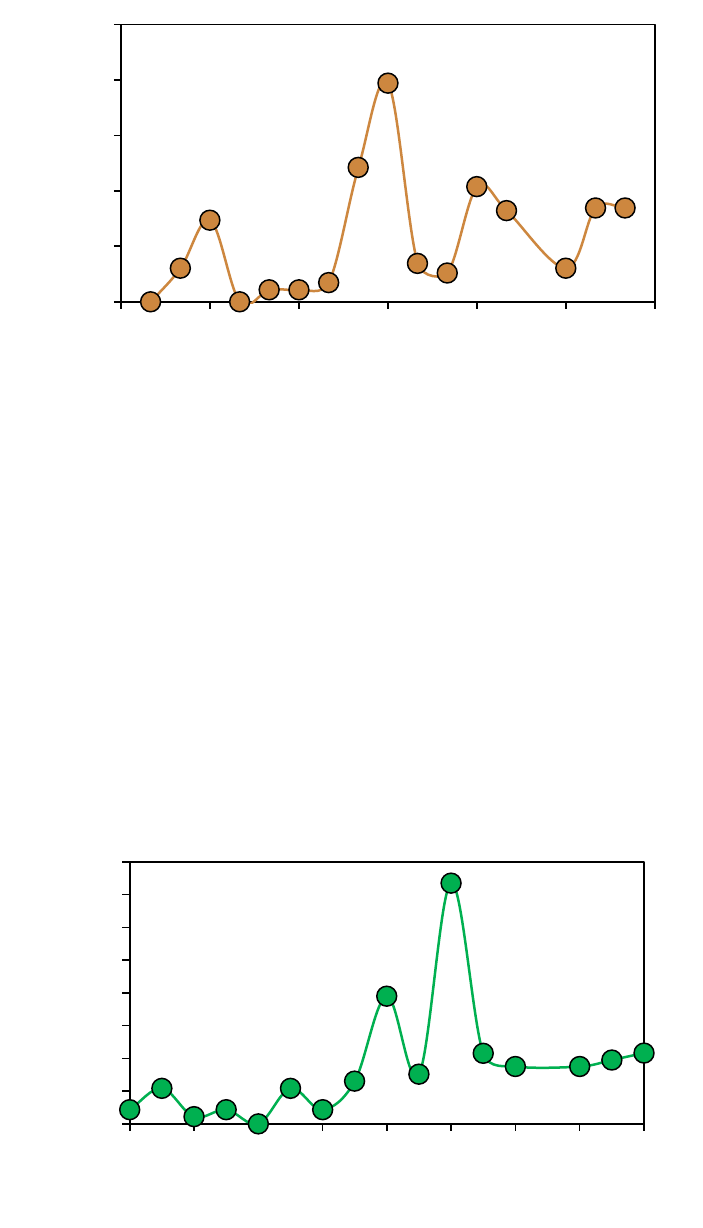
CPUE of YOY brown trout was 169 fish/mile, which was above the historical mean (108
± 27 fish/mile; standard error; Figure 4). Recruitment rates during 2007 – 2013 (41 ± 19
YOY/mile; standard error) were lower than in 2016 – 2023 (127 ± 36 YOY/mile;
standard error; P = 0.02; t-test). Recruitment was highly variable annually but appears
to have generally increased through time despite no trend being detected (P = 0.14;
simple linear regression; Figure 4).
0
10
20
30
40
50
<3 3 4 5 6 7 8 9 10 11 12 13 14 15 16 17 18 19 20
Frequency
Total length (in)
0
20
40
60
80
100
2006 2009 2012 2015 2018 2021 2024
PSD-9
Year
5
Figure 4. CPUE of young-of-year (< 3 inches) brown trout sampled from the Brill River, Barron County,
Wis. during 2007 - 2023.
BROOK TROUT
A low density, naturally reproducing brook trout population was present in the Brill
River. There were 10 brook trout collected with a CPUE of 43 fish/mile (Figure 5).
Brook trout CPUE during 2023 was above the historical average (34 ± 9 fish/mile;
standard error; 2007 - 2023) but well below the Barron and Polk counties mean CPUE
(623 ± 88 fish/mile; standard error; indexed using 77 survey sites across 41 rivers and
streams during the past decade). Brook trout relative abundance generally increased
over time, although no temporal trend in CPUE was detected (P = 0.08; simple linear
regression). However, CPUEs during 2007 – 2014 (14 ± 9 fish/mile; standard deviation)
were lower than in 2015 – 2023 (56 ± 40 fish/mile; standard deviation; P = 0.02; t-test).
Figure 5. CPUE of brook trout sampled from the Brill River, Barron County, Wis. during 2007 - 2023.
0
100
200
300
400
500
2006 2009 2012 2015 2018 2021 2024
CPUE
Year
0
20
40
60
80
100
120
140
160
2007 2009 2011 2013 2015 2017 2019 2021 2023
CPUE
Year
6
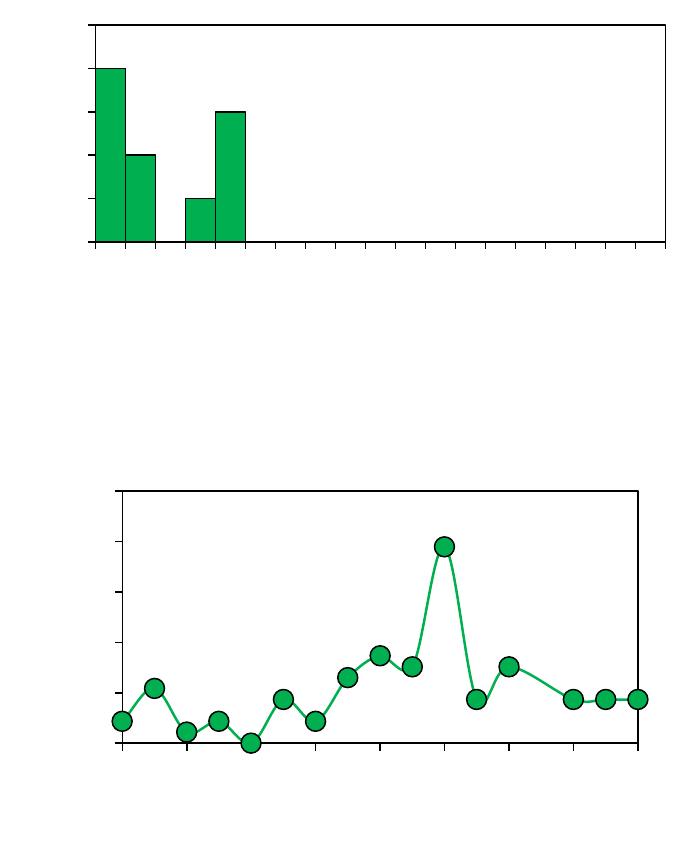
Brook trout ranged in length from < 3 inches to 6.0 inches, with 40% of the population
greater than 5 inches and presumably only two age classes present based on the
population size structure (Figure 6). Too few fish were sampled to estimate PSD
indices. The CPUE of brook trout ≥ 5 inches was 17 fish/mile, which was lower than the
historical mean (21 fish/mile) but remained stable through time (P > 0.05; simple
linear regression; Figure 7).
Figure 6. Length frequency histogram of brook trout sampled from the Brill River, Barron County, Wis.
during 2023.
Figure 7. CPUE of brook trout ≥ 5 inches sampled from the Brill River, Barron County, Wis. during 2007 -
2023.
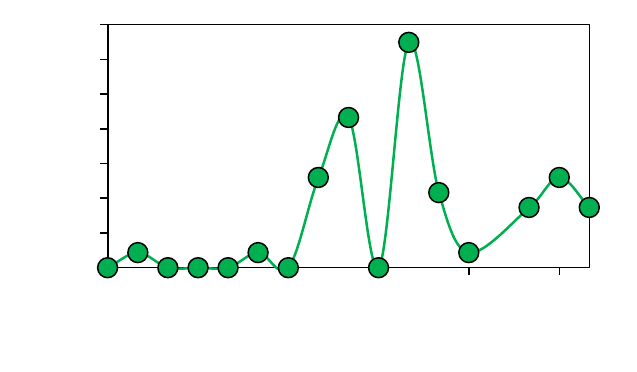
The CPUE of YOY brook trout was 17 fish/mile, which resembled the historical mean
(14 ± 5 fish/mile; standard error; Figure 8). Recruitment rates were highly variable
annually but generally increased since 2013, although no temporal trend was
detected (P = 0.08; simple linear regression). Despite this, recruitment rates during
0
1
2
3
4
5
<3 3 4 5 6 7 8 9 10 11 12 13 14 15 16 17 18 19 20
Frequency
Total length (in)
0
20
40
60
80
100
2007 2009 2011 2013 2015 2017 2019 2021 2023
CPUE
Year
7
2007 – 2013 (1.0 ± 0.8 YOY/mile; standard error) were lower than in 2016 – 2023 (20 ± 7
YOY/mile; standard error; P < 0.01; t-test).
Figure 8. CPUE of young-of-year (< 3 inches) brook trout sampled from the Brill River, Barron County,
Wis. during 2007 - 2023.
Discussion
A quality brown trout fishery occurs in the Brill River. Population abundance was
moderate but temporally stable, which suggests the population may be at carrying
capacity. Size structure was high, with good catch rates of brown trout greater than 15
inches and overall good trophy potential. Multiple year classes were represented in
the size structure which indicates good annual recruitment.
The brook trout population remained at a low density, but rates of natural
recruitment over the past decade increased, which coincided with a similar temporal
increase in population abundance. Brook trout abundance is not expected to
drastically increase due to the presence of a thriving brown trout population and
marginal thermal conditions. Management will continue to focus primarily on
maintaining a quality brown trout population.
Only a few river miles of the Brill River support suitable thermal conditions for trout.
Thermal conditions tend to be warmer than smaller headwater streams and would
likely be classified as marginal trout water. Marginal thermal conditions on the
warmer end typically support greater forage abundance and fast growth of brown
trout. Although age and growth data were not collected during this survey, growth
was presumably fast based on high size structure, warm water temperatures and a
robust minnow forage base. However, it is likely that warmer conditions are limiting
the population growth of brook trout, as they tend to prefer cooler water
temperatures.
0
10
20
30
40
50
60
70
2007 2010 2013 2016 2019 2022
CPUE
Year
8
Natural recruitment of brown trout was relatively consistent over time but the
contribution of natural recruits and stocked fish to the adult population remained
unknown. In the absence of future stocking, we will assess the contribution of natural
recruits to the adult population. Spawning habitat was plentiful throughout the
sampling transect on the Brill River and does support natural reproduction of both
trout species. Stocking of brown trout in the Brill River is currently not
recommended, as natural recruitment seems sufficient to support a viable
population. Natural recruitment will continue to be indexed annually, and if YOY and
adult catch rates significantly decline, then stocking may again be considered to
support a fishable population.
The DNR designates type II trout streams as having some natural reproduction,
though insufficient to maintain a viable population, necessitating stocking to support
a desirable fishery. Adult fish in these streams often exhibit strong survival rates with
conditions suitable for producing larger-than-average-sized fish. In contrast, type I
streams boast ample natural reproduction, sustaining populations near carrying
capacity and do not require stocking. However, these streams are typically small,
cold headwaters with slow-growing trout. The brown trout population in the Brill
River currently falls between type I and II classifications, as natural reproduction
appears to support a population with good growth and size structure despite
marginal thermal habitat conditions. To consider a potential reclassification of the
Brill River trout fishery, additional survey data is required in the absence of stocking.
The Brill River stands out as one of a few streams in Barron and Polk counties with
conditions conducive to producing trophy-sized brown trout, or those exceeding 20
inches in length. The existing special fishing regulation, a daily bag limit of two trout
over 12 inches, will be maintained to minimize harvest mortality and preserve a high
population size structure.
Recommendations
1. Maintain a stable adult (≥ 6 inches) brown trout population near the historical
average of 260 ± 82 fish/mile (± standard deviation). This population
benchmark should continue to support moderate density with a high size
structure. Stocking may be considered if population abundance declines below
this benchmark consistently, which would indicate poor survival of natural
recruits to the adult population.
2. Brown trout natural recruitment should be closely monitored following
cessation of stocking. Catch rates of 127 ± 64 YOY brown trout/mile (average of
2016 – 2023; ± standard deviation) should continue to support a quality
population. Stocking may be considered if natural recruitment declines
consistently below this benchmark.
3. The current special fishing regulation of a daily bag limit of two trout over 12
inches should be maintained.

9
4. Following the 2028 summer survey, analyses of recruitment, age, growth and
population demographics should be revisited, and if warranted, the
reclassification of the Brill River trout fishery should be considered.
5. Habitat enhancement efforts are encouraged and should be explored if
possible; however, this would likely require streambank easements or fee title
acquisition.
Acknowledgements
Special thanks to Craig Landes and Aaron Cole for assisting with field collection,
aging and data entry.
References
Neumann, R.M., C.S. Guy, and D.W. Willis. 2013. Length, weight, and associated indices.
Pages 637-676 in A.V. Zale, D.L. Parrish, and T.M. Sutton, editors. Fisheries
techniques, 3
rd
edition. American Fisheries Society, Bethesda, Maryland.
Appendices
Appendix Table 1. Brown trout stocking records for the Brill River, 2000 – 2022.
YEAR
STRAIN
NUMBER STOCKED
AVG. LENGTH (IN.)
2022
Timber Coulee
5,500
3.3
2021
Timber Coulee
5,800
3.2
2020
Timber Coulee
6,000
3.2
2019
Timber Coulee
5,516
2.9
2018
Timber Coulee
4,965
2.95
2017
Timber Coulee
7,200
3.1
2016
Timber Coulee
6,236
3
2015
Timber Coulee
6,950
3
2014
Timber Coulee
2,246
2.7
2013
Timber Coulee
3,146
2.6
2012
Timber Coulee
7,999
2.9
2011
Timber Coulee
8,800
2.8
2010
Timber Coulee
4,420
3.2
2009
Timber Coulee
5,399
3.2
2008
Timber Coulee
5,250
3.1
2007
Timber Coulee
4,500
3.2
2006
Timber Coulee
6,000
3.3
2005
Timber Coulee
6,000
3.5
2004
Timber Coulee
12,000
1.8

10
2003
St. Croix
20,000
3
2003
St. Croix
2,000
9.3
2002
St. Croix
2,000
9.2
2001
St. Croix
4,000
9.15
2000
St. Croix
2,000
5.5
