June 2022 | wq-ws3-07080201c
Watershed assessment and trends update
Why is it important?
The Cedar, Shell Rock, Winnebago, and Wapsipinicon Rivers located
along the Minnesota/Iowa border are important water resources for
local communities. All four of these watersheds flow out of Minnesota
through Iowa and into the Mississippi River. With the headwater
portion of these watersheds in Minnesota, activities in these rivers have
considerable impact on the water quality and beneficial uses
downstream in the neighboring state of Iowa. These rivers provide
considerable recreational opportunities such as fishing, canoeing, and
kayaking. Gamefish species sought by anglers include northern pike,
smallmouth bass, catfish, and walleye. Canoeing and kayaking are
popular; portions of the Shell Rock River, Cedar River in Minnesota and
Iowa, and the Wapsipinicon in Iowa, are designated water trails. These
rivers also provide important habitat and corridors for wildlife and
aquatic communities. A portion of the Wapsipinicon near the Mississippi
River is one of five designated Protected Water Areas in Iowa. The
second largest city in Iowa, Cedar Rapids, depends on this important
water resource for drinking water.
This update summarizes the second round of intensive monitoring for these watersheds. This on-
going monitoring of these valuable resources helps determine progress toward these waters
meeting water quality standards, preserving the beneficial uses for the future, and helps refine
management decisions for improving degraded water resources.
Is the water quality improving?
Over the past five to ten years scientists observed little change overall in water quality of the
Cedar, Shell Rock, Winnebago, and Wapsipinicon River Watersheds. While the biological condition
in individual streams may have improved or declined between initial monitoring and the current
monitoring effort, the overall health of fish and macroinvertebrate communities did not
significantly change over this period. Continued problems include elevated bacteria, excess
sediment (turbidity), nutrients, and low dissolved oxygen levels. Surface water monitoring is
essential to determining whether lakes and streams meet water quality standards designed to
ensure that waters are fishable and swimmable.
While local partners and state agencies monitor water quality on an ongoing basis, the Minnesota
Pollution Control Agency (MPCA) and local partners conduct an intensive survey of major lakes and
streams in each of the state’s 80 watersheds every 10 years.
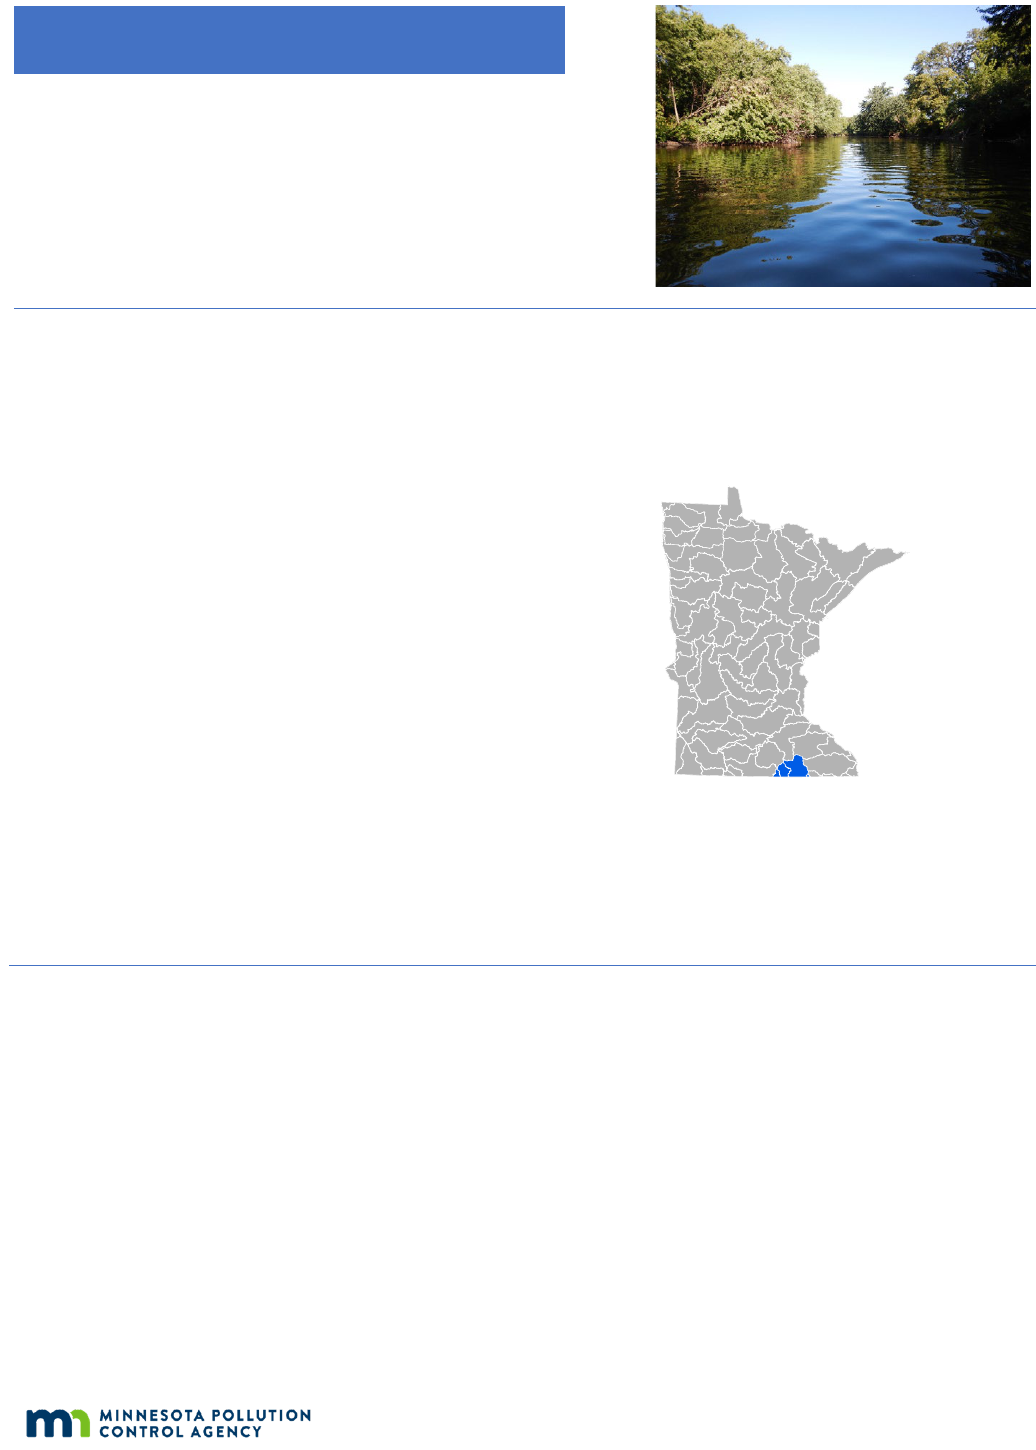
Cedar, Shell Rock, Winnebago,
and Upper Wapsipinicon River
Watersheds
Cedar River Basin
Figure 1
. From west to east, the Winnebago,
Shell Rock, Cedar, and Upper Wapsipinicon River
Watersheds locations in Minnesota

2
June 2022 | wq-ws3-07080201c
To detect any changes in water quality, this intensive survey looks at fish and macroinvertebrate
communities as well as water chemistry. Data is examined to determine which waters are healthy
and need protection, and which are polluted and need restoration.
Landowners have installed hundreds of best management practices (BMPs) to improve water
quality, but many more are needed. It takes time for these practices to show results.
• The overall quality of the fish communities across the four major watersheds increased
slightly since the initial sampling in 2009 for the Cedar River and Shell Rock River
Watersheds, and 2015 for the Winnebago River and Wapsipinicon River Watersheds. As a
result of the 2019 sampling, three reaches had fish community impairments that were
delisted/corrected, which reduced the total from 21 to 19 aquatic life impairments based
on fish for the four watersheds.
• Stream macroinvertebrate communities exhibited a net increase in biological condition,
with five streams that were either delisted or corrected on the 2022 Impaired Waters List,
and two new macroinvertebrate impairments, which reduced the total number of
macroinvertebrate impairments from 39 to 36.
• The quality of the fish communities in the mainstem Cedar, Shell Rock, and Wapsipinicon
Rivers improved from initial sampling to 2019. More specifically, the quality of the fish
communities in County Ditch 16 (Shell Rock River Watershed) and the Middle Fork of the
Little Cedar River (Cedar River Watershed) have improved considerably.
• The quality of the fish community at the pour-point of the Winnebago River (Lime Creek)
Watershed at the Iowa border declined slightly since 2015. The largest declines in fish
community quality occurred in the Little Cedar River (mainstem) and Woodbury Creek in
the Cedar River Watershed. For now, these streams are still meeting water quality
standards for the fish community.
• The quality of both the fish and macroinvertebrate communities improved in the Cedar
River near Austin as well as County Ditch 16 in the Shell Rock River Watershed.
• No lakes in this study exhibited declining clarity.
Highlights of monitoring
• Two stations in the Cedar River Watershed have been designated as long-term monitoring
locations, and each have been sampled six times between 2009 and 2019. After initially
being listed as impaired in 2009, long-term monitoring stations on Woodbury and Roberts
Creeks have consistently yielded macroinvertebrate index of biological integrity (IBI)
scores indicative of a healthy community, resulting in the removal of the
macroinvertebrate impairments from the 2022 Impaired Waters List. Roberts and
Woodbury Creeks currently support quality fish communities. Despite healthy aquatic
communities, Roberts Creek is potentially susceptible to failing to meet water quality
criteria if degradation occurs.
• Although Fountain Lake was assessed as impaired for aquatic recreation in 2008 and
aquatic consumption in 2012, fish community data had not been collected to assess
aquatic life until 2018. This data confirms that Fountain Lake is also impaired for aquatic
life, which aligns with the previous beneficial use assessments.
3
June 2022 | wq-ws3-07080201c
• A total of 50 fish species were collected during the 2019 watershed survey. Of these, 15
are considered sensitive species — susceptible to pollution and watershed disturbance.
One of these species, the Ozark minnow, is a State Species of Concern. Seven of the
species are considered tolerant, while nine of the species are considered very tolerant to
watershed stressors.
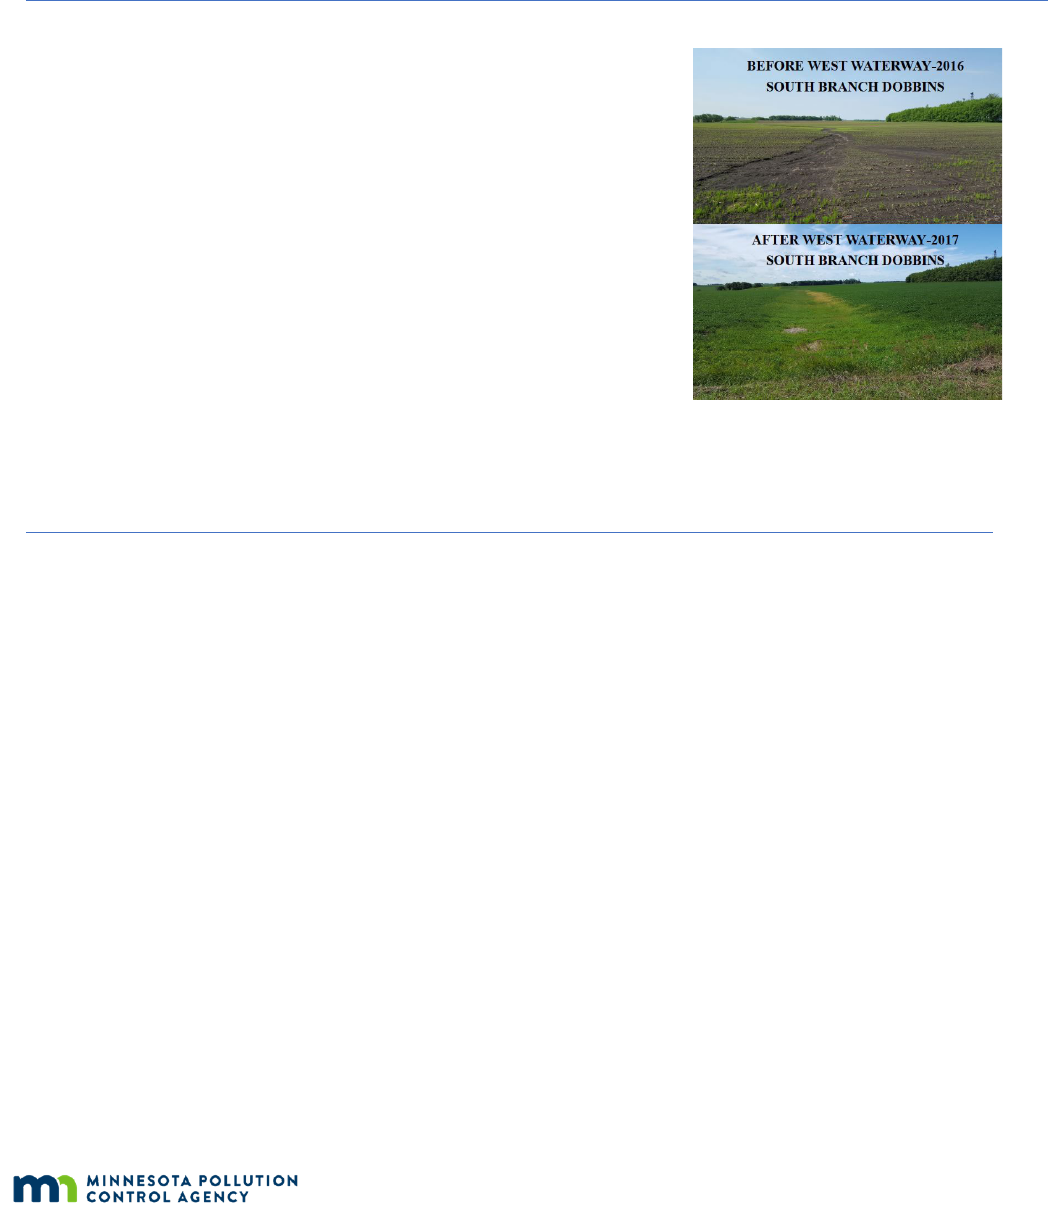
Success story
In the Dobbins Creek Subwatershed (Cedar River Watershed) ongoing
projects to increase water storage and restore stream channel condition
have occurred since 2009. Some of these projects include grassed
waterways (Picture 1) to reduce erosion in fields and reduce sediment in the
stream, along with water storage structures to reduce the impact of high-
flow rain events on stream condition. While the upper reaches of Dobbins
Creek have been shown to have poor macroinvertebrate and fish
communities, the lower reaches below and within the area receiving
restoration have shown a consistently healthy macroinvertebrate and fish
community. Fish samples in this lower reach of Dobbins Creek consist of 16
to 21 species, only one to two intolerant species, and two to five sensitive
species (5-15% of individuals in the samples) representing a balanced and
diverse fish community. Efforts to restore riparian areas and instream
habitat in reaches that have persistent flow conditions create the
opportunity for macroinvertebrate and fish communities to thrive.
Watershed assessment results
MPCA and partners initially monitored water quality conditions in 2008-2009 in the Cedar River, in
2009-2010 in the Shell Rock River, and in 2015-2016 in the Winnebago River and the Upper
Wapsipinicon River Watersheds. Water quality conditions were monitored again in 2019-2020
across the entire basin (within Minnesota). Chemistry data collected by MPCA and some local
partners between 2011 and 2020 were used for assessment. The data used to assess the condition
of Minnesota waterbodies focus on whether they are meeting water quality standards for aquatic
life, recreation, and consumption. The goal of these assessments is to determine which waters are
healthy and in need of protection, and which are polluted and require restoration.
Picture 1. Field condition before and after
implementation of a grass
ed waterway
within the Dobbins Creek
Subwatershed.
Photo
courtesy of Mower County SWCD.
4
June 2022 | wq-ws3-07080201c
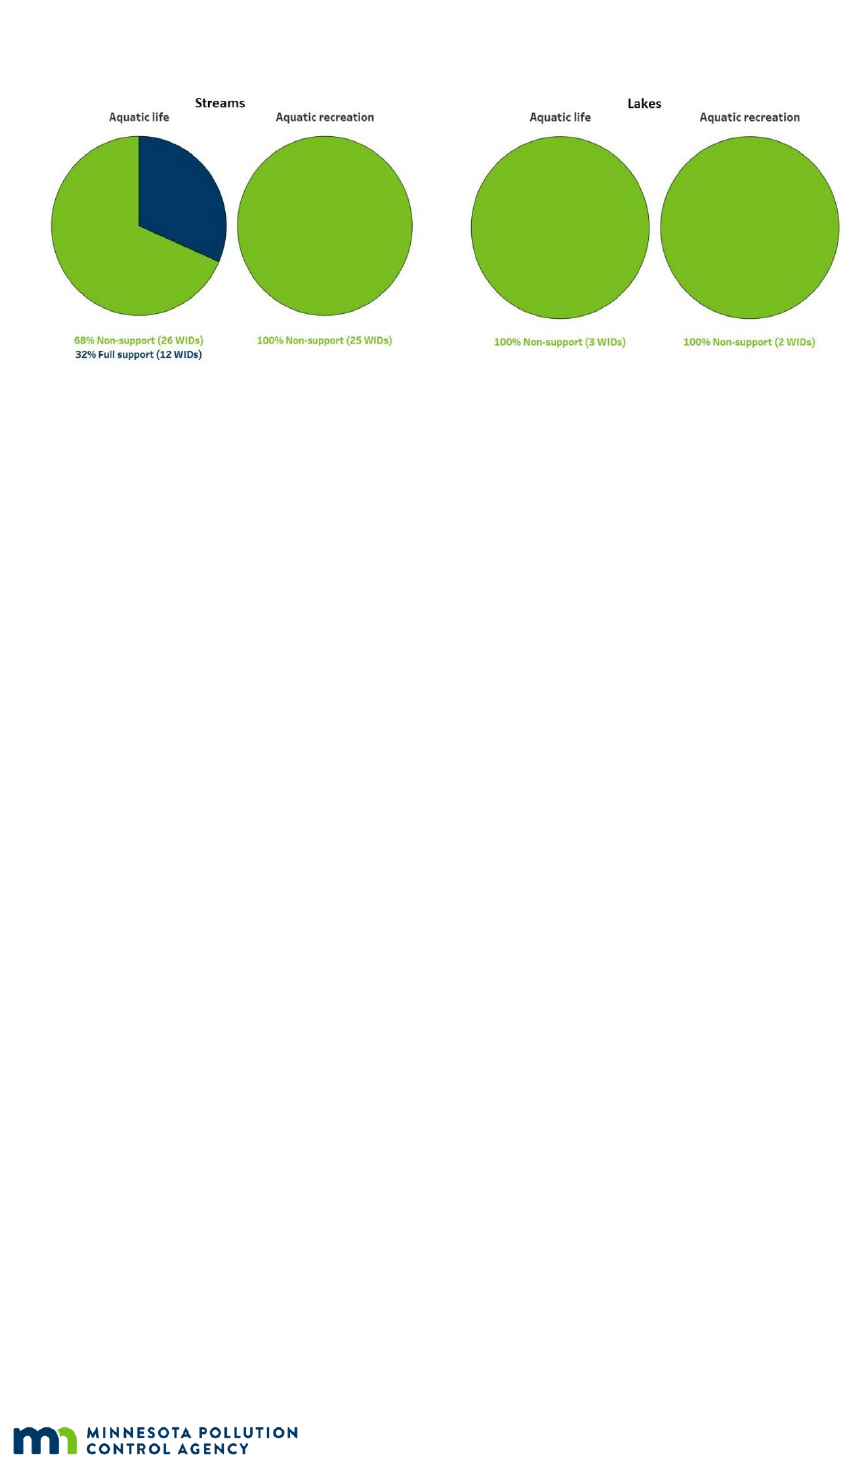
Streams and rivers
Across the Cedar Basin watersheds, 38 stream reaches have been assessed for aquatic life, with
32% of the stream reaches supporting their designated aquatic life uses (Figure 2). Of the 36
stream reaches assessed for aquatic life based on biology, 18 existing fish impairments remained
after the current sampling effort, along with the addition of one new fish impairment. Thirteen
reaches had supporting fish and macroinvertebrate communities. Another 13 reaches had
supporting fish communities, with non-supporting macroinvertebrate communities, and two of
which were not assessed or sampled for macroinvertebrates.
Four stream reaches in the Cedar Basin that were previously listed as impaired due to poor
macroinvertebrate community health have been recommended to be delisted for
macroinvertebrate impairment due a consistent increase in community health scores: two reaches
in the Cedar River Watershed, one in the Shell Rock River Watershed, and one in the Winnebago
River Watershed. There are not clear associations between the increased community scores and
changes in the contributing watershed, but a clear upward trend in biological conditions is
encouraging to see. The trend of increasing precipitation and associated stable flows, as well as
these stations having good instream habitat, intact riparian zones, and/or buffers, could also be a
contributing factor to the presence of a more resilient macroinvertebrate community.
Three reaches: Bancroft Creek in the Shell Rock River Watershed, Turtle Creek near the confluence
with the Cedar River, and the Wapsipinicon River were removed from the Impaired Waters List as
the result of the fish communities currently meeting water quality standards. These improvements
to the fish community are not attributed to specific projects in upstream watersheds; several
potential factors over time likely contributed to the attainment of standards, including changes to
BMP practices, buffer strips, and changes to fish barriers.
None of the assessed stream reaches in the basin were found to be supporting the aquatic
recreation designated use due to elevated levels of bacteria. Data from monitoring conducted in
2019-2020, and by local partners between 2011-2020, confirmed 13 of the 21 previous bacteria
impairments from past monitoring efforts, resulting in new E. coli impairments on 12 stream
reaches (eight of the reaches lacked sufficient data for assessment, but existing impairment
designations will remain). These new impairments are unlikely to be a signal of any significant
negative change in watershed condition since initial monitoring was completed in these
watersheds. Rather, the new impairments are more likely a function of enough data to assess in
these watersheds. Nine of the 12 new impairments are in the Dobbins Creek Subwatershed of the
Cedar River Watershed, which was monitored intensively by Cedar River Watershed District and
the University of Minnesota in the summer of 2015. Monitoring data also showed three streams
vulnerable to impairment due to excess bacteria, indicating elevated bacteria counts near the
standard.
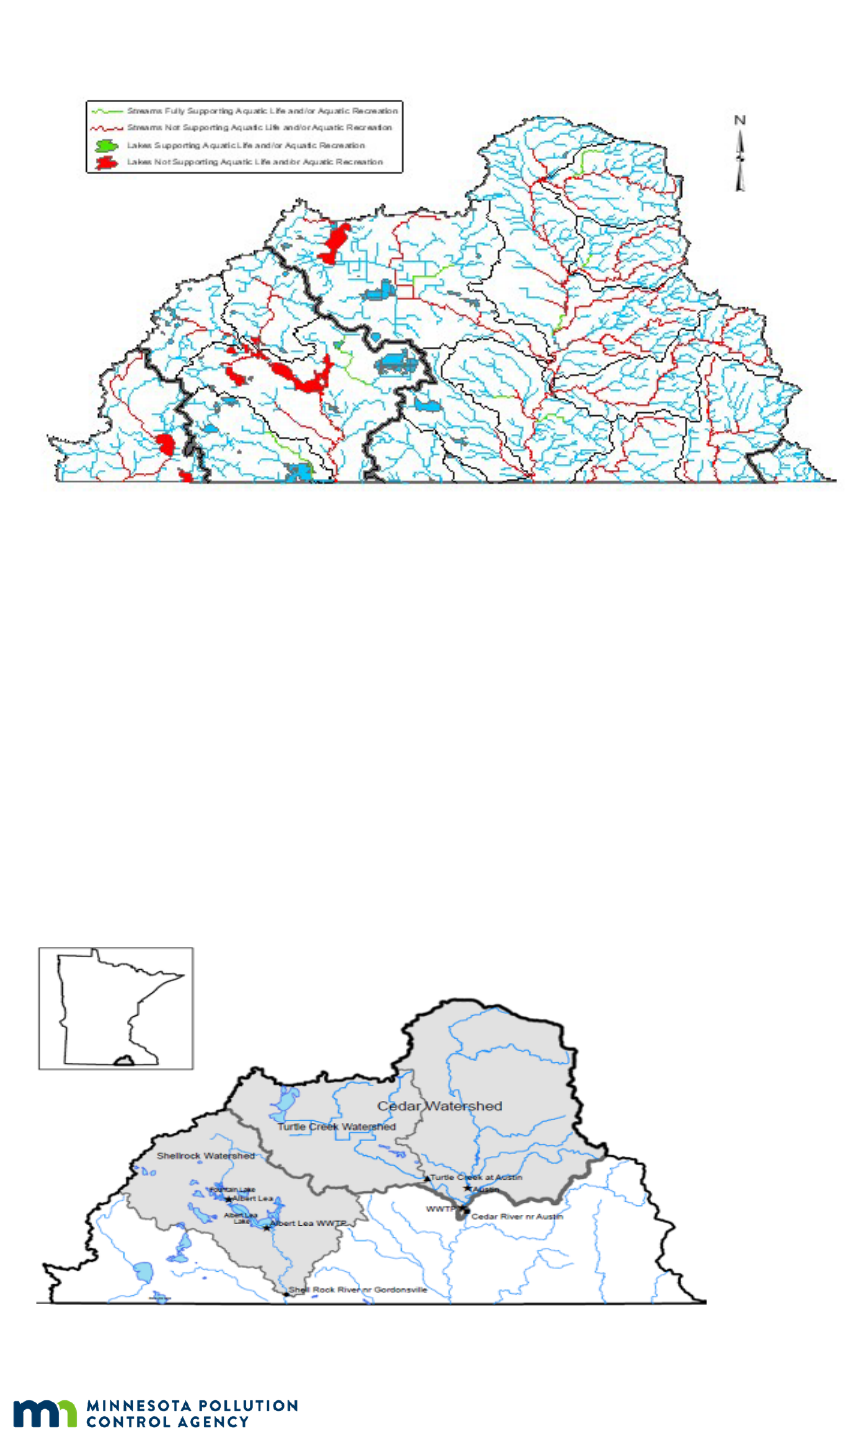
Figure 2. Assessment results for aquatic life and aquatic recreation of lakes and streams in the
Cedar Basin Watersheds. Fountain Lake consists of 3 WIDs (North, East, and West bays).

5
June 2022 | wq-ws3-07080201c
Excess sediment, also referred to as turbidity and TSS (total suspended solids), impacts many of
the Cedar River Basin’s streams. There are 10 stream reaches with existing turbidity impairment
listings in the basin, along with one stream with an existing TSS impairment. Data from the
monitoring conducted in 2019-2020 confirmed four of these previous turbidity impairments from
past monitoring efforts and resulted in a new TSS impairment on the Cedar River from its
headwaters to Roberts Creek and on Roberts Creek from an unnamed creek near Brownsdale to
the Cedar River. Six of the reaches lacked sufficient data to assess for TSS, but existing turbidity
impairments will remain. Additionally, two stream reaches in the basin were identified as being
vulnerable to TSS impairment based on monitoring data.
Previous monitoring and assessment along with stressor identification efforts within the Cedar
River Basin have identified low dissolved oxygen in streams as an issue, with five existing
impairments for dissolved oxygen in the basin. Data collected between 2011 and 2020 confirmed
the impairments for four of the five existing impairments, with one stream reach having
insufficient information to assess. Additionally, these monitoring efforts resulted in a new
dissolved oxygen impairment on an unnamed creek downstream of Judicial Ditch 25 in Freeborn
County. All but one of the dissolved oxygen impairments in the basin are found within the Lime
Creek Subwatershed of the Winnebago River Watershed. These stream reaches are low-gradient,
highly altered, and drain into and out of the nutrient-impaired Bear Lake — all factors that likely
contribute to the low dissolved oxygen observed.
Three stream reaches in the basin have impairments for river nutrients based on a multi-part
standard that includes total phosphorus (TP) and one or more of the following response variables:
pH, chlorophyll-a, dissolved oxygen flux, biological oxygen demand (BOD). The river nutrient
impairment in the Shell Rock River from Albert Lea Lake to Goose Creek was confirmed with new
data collected through 2019-2020 monitoring efforts. MPCA recently completed a Total Maximum
Daily Load (TMDL) study that was approved by the U.S. Environmental Protection Agency in June
2021 to address this river’s nutrients impairment and others across the Shell Rock River
Watershed. The other two impairments for river nutrients will remain listed due to insufficient or
inconclusive (e.g., near the applicable water quality standards) data.
Throughout the Cedar River Basin, elevated bacteria, excess sediment (TSS/turbidity), and low
dissolved oxygen were the most common chemical impairments found. Impairments for river
nutrients were also found on a smaller number of stream reaches across the basin. Land use
throughout the basin is dominated by cultivated crops, and many stream channels have been
heavily altered, which may contribute to and exacerbate these water chemistry impairments.
A pH impairment on the Shell Rock River (07080202-501) from Albert Lea Lake to Goose Creek will
be removed from the Impaired Waters List due to a strong dataset that shows pH standards being
met for most of the assessment data window (2011-2020).
6
June 2022 | wq-ws3-07080201c
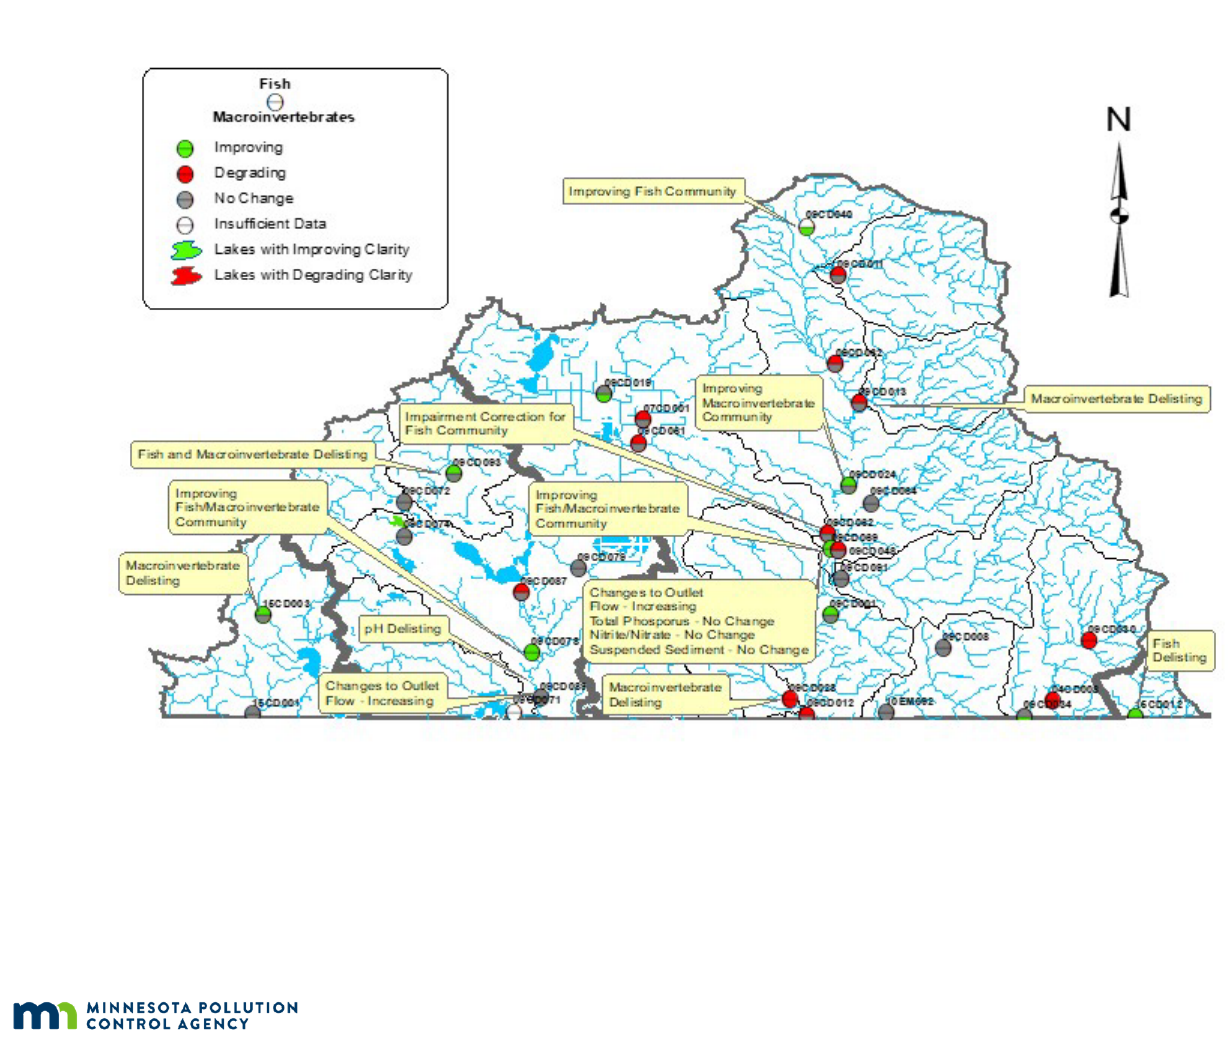
Cedar River Watershed long-term monitoring stations
Due to both state and local concerns and the impacts that the Cedar River has on downstream
waters, two Watershed Pollutant Load Monitoring Network (WPLMN) sites were installed to better
understand water quality and pollutant loading dynamics within the watershed.
One site is the outlet site, the other is the Turtle Creek Subwatershed site. The Turtle Creek
Subwatershed site represents a large ditch system in which the watershed is drained primarily by
sub-surface drain tile. On average, the Turtle Creek Subwatershed accounts for 25% of the annual
TP load, the City of Austin’s Wastewater Treatment Plant (WWTP) accounts for 34%, and the upper
watershed accounts for 42% of the total TP load. The WWTP is in the process of an upgrade, and
annual phosphorus loads are estimated to be reduced by 12%, or 20 metric tons annually.
Figure 4. Location of Watershed Pollutant Load Monitoring network stations in the Cedar Basin.
Figure 3. Watershed assessment results for the Cedar River Basin.
7
June 2022 | wq-ws3-07080201c
Annual nitrate flow-weighted mean concentrations
(FWMC) at the outlet site are 9-9.5 mg/L while the
Turtle Creek site averages 8.75 mg/L. Currently
Minnesota does not have a river nitrate standard
unless the river is used as a source of drinking water.
This is not the case for the Cedar River in Minnesota;
however, the drinking water standard of 10 mg/L
provides a reference when looking at the overall
condition of the river. Concentrations near or above
this standard are not a good thing. The downstream
city of Cedar Rapids, Iowa, must draw water from
Ranney wells because the river concentrations are
normally above 10 mg/L. These Ranney wells provide
some protection but are still strongly influenced by
the river. On average, 26% of the annual nitrate load
can be attributed to the Turtle Creek Subwatershed.
Since the nitrate concentrations tend to run higher at
the outlet site, the WPLMN installed a continuous
nitrate monitoring probe at the site that currently
collects data at 15-minute intervals. In the future, real
time nitrate loads will be available based on this
continuous probe data.
The Austin WWTP upgrade will also help to reduce a
portion of the nitrogen load. The upgrade will include
a bioreactor to help reduce total nitrogen in the
effluent. The WWTP plant measures total nitrogen
which is composed of (NO2+NO3+TKN). Currently the
WPLMN samples for NO2+NO3 and TKN as separate
parameters.
TSS is primarily related to higher flow storm events.
On average, the Turtle Creek Watershed contributes
approximately 39% of the TSS annual load. The average FWMC of TSS is 38.2 mg/L at the outlet
site and 55.6 mg/L at the Turtle Creek site.
Shell Rock River Watershed long-term monitoring stations
Since the Shell Rock River drains to Iowa, the WPLMN placed a long-term monitoring site just
above the Minnesota/Iowa border. This site helps to provide a better understanding of water
quality and pollutant load dynamics within the watershed, as well as the Shell Rock River’s load
contribution to Iowa. The long-term nature of these stations is critical for trend analysis,
measuring between-year differences in pollutant loading, and helping determine pollutant sources
and their contributions. Over the past decade, the Shell Rock WPLMN site still has much higher
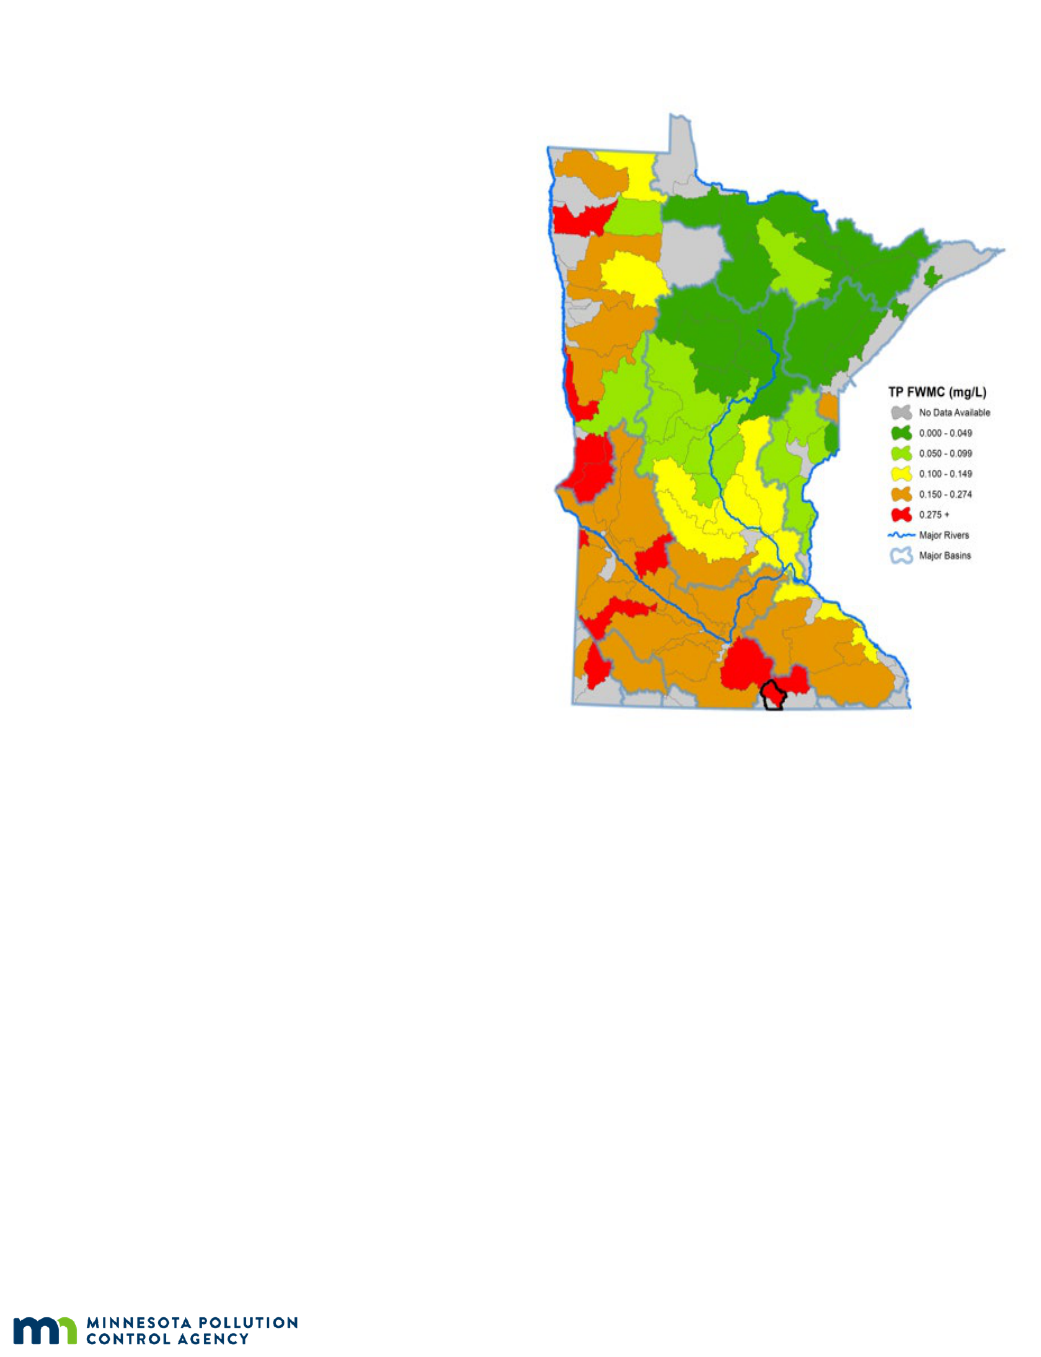
than desired levels of phosphorus and nitrate (Figure 6).
Figure 5. Average nitrate/nitrite flow weighted mean
concentration by major Minnesota watershed, with the
Cedar River
Watershed outlined in black.
8
June 2022 | wq-ws3-07080201c
The high phosphorus concentrations and loads can be
partially attributed to the City of Albert Lea’s WWTP;
about 45% of the phosphorus load. Plans to upgrade the
city’s WWPT are underway, and TP loads contributions
are expected to be reduced by 32%. There is also
currently a project to dredge portions of Fountain Lake,
which will also help to further reduce TP concentrations
in the river.
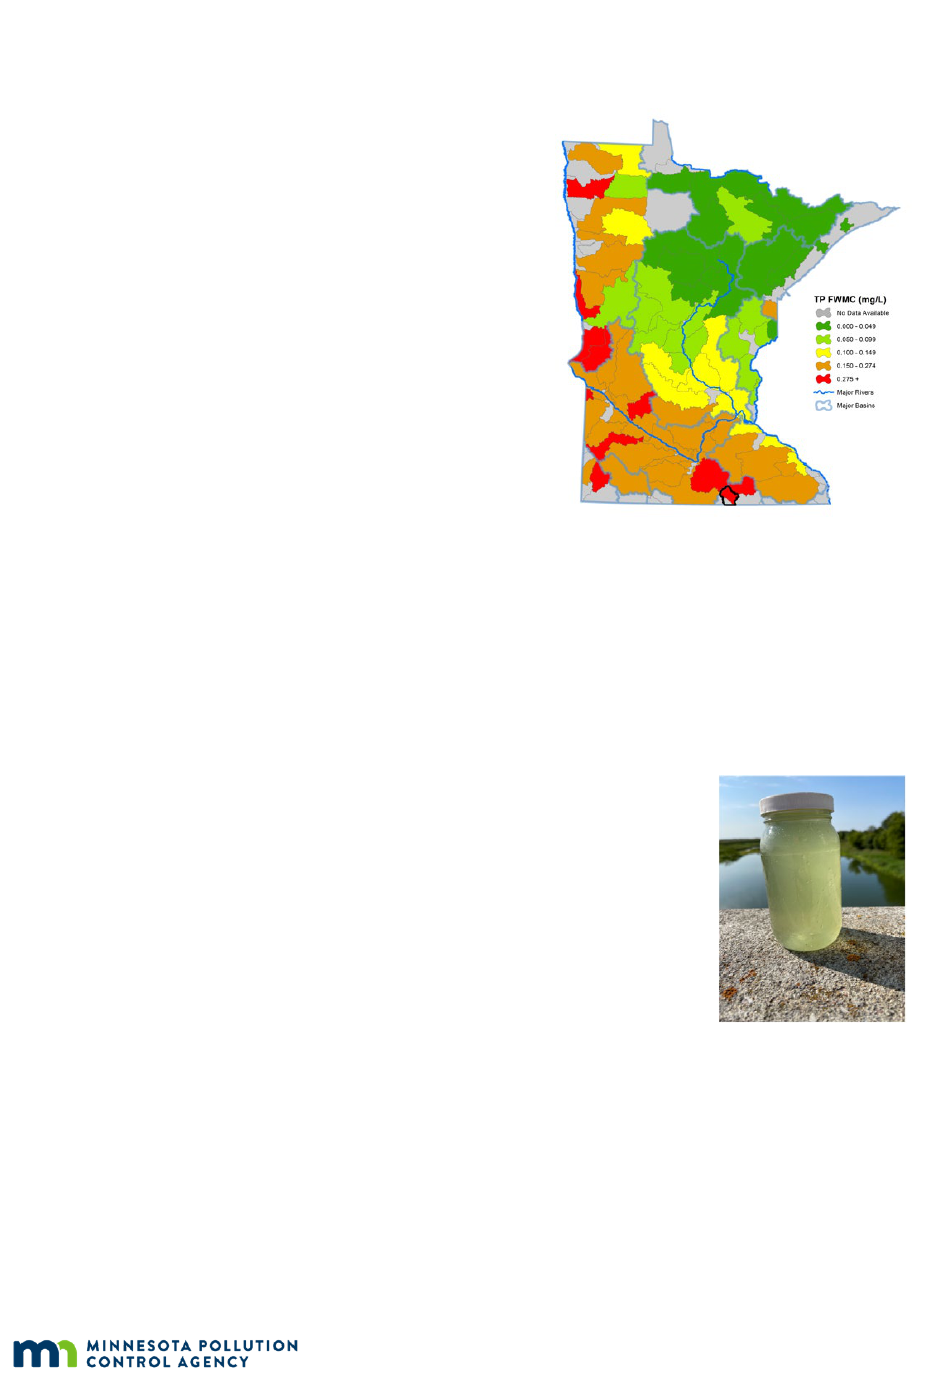
Suspended sediment concentrations tend to be on the
low end for this portion of the state. An average FWMC
of 27.3 mg/L is likely the result of a series of lakes
(including Albert Lea Lake) upstream that allow sediment
to settle out. The solids often noticed at the monitoring
site tend to be in the form of algae and are likely the
product of high phosphorous concentrations (Picture 2).
Lakes
Shallow lakes with highly disturbed watersheds due to
agricultural and urban (shoreline) development
dominate the landscape in the Cedar River Basin. All the
lakes for which sufficient data was available for assessment were found to not support the aquatic
recreation designation use due to excess nutrients. Overall, no new lake recreation impairments
resulted from this assessment process based on data collected from 2011-2020. All nine of the
existing nutrient impairments will remain on the basin’s lakes. Several lakes in the basin had
recently undergone or were undergoing water level drawdowns for wildlife management in
coordination with the Minnesota Department of Natural Resources. Data from these lakes were
not assessed as they are not representative of typical hydrologic states for these lakes.
Although the Cedar River Basin contains numerous shallow lakes, only Fountain
Lake was eligible to be assessed for aquatic life use based on fish IBI data. Other
lakes in the basin were either subject to recent winterkill events that adversely
impacted fish or were too small for the fish IBI to be appropriate. Fountain
Lake, which consists of three WIDs (East, North, and West bays), was found to
have an impaired fish community. During the fish IBI surveys, 17 fish species
were captured. All six species classified as tolerant in the fish IBI (Bigmouth
Buffalo, Black Bullhead, Common Carp, Fathead Minnow, Green Sunfish, and
Orangespotted Sunfish) were sampled whereas no small benthic-dwelling
species were sampled. These metrics, in addition to the other metrics used in
the fish IBI, were below expectations when compared to similar healthy lakes.
Stressors that are likely influencing this community include excess nutrient
inputs from agricultural and urban land uses, degraded and/or developed
shorelines, and internal loading.
Picture 2. Water
collected from the Shell
Rock River.
Figure 6.
Average total phosphorus flow-weighted
mean concentration by major Minnesota
watershed, with the Shell Rock Watershed
outlined in black.

9
June 2022 | wq-ws3-07080201c
Local partners are active across the basin’s watersheds in implementing BMPs to improve water
quality in the valued lakes found in the basin, but ultimately the condition of lakes in the Cedar
River Basin is changing slowly (if at all). BMPs implemented on the landscape targeting
improvements in lake water quality will require time to be reflected in monitoring results. Internal
loading (the recycling of phosphorus within a lake) will also have to be addressed after watershed
inputs of nutrients are controlled for lakes in the watershed.
Trends
A key objective of the 2019 monitoring effort was to evaluate if and how water quality has
changed since the initial monitoring (Figure 7). Where water quality has improved, it’s important
to understand what may have caused this improvement. This helps affirm actions taking place on
the landscape and can further promote additional action. To help inform future monitoring
activities, it is equally important to understand if water quality does not appear to be changing or
is declining.
Trends in four categories of water quality data were analyzed to provide a robust picture of what is
happening in the Cedar Basin watersheds:
1) Streamflow and pollutant concentrations (sediment (TSS), TP, and nitrate)
2) Biological communities
3) Clarity of lakes and streams
4) Climate
10
June 2022 | wq-ws3-0708201c
Figure 7. Change in water quality in the Cedar Basin watersheds.
11
June 2022 | wq-ws3-0708201c
Streamflow and pollutant concentrations
Trend analysis for nitrate, phosphorus, and suspended sediment concentrations was done for the
period of 2008-2019 at the monitoring station near the outlet of the Cedar River Watershed. All
three parameters (NO2+NO3, TP, and TSS) showed no significant change. Trend analysis was not
possible at the Turtle Creek Subwatershed station as it has not been operating for a long enough
period; this analysis will be possible in the future. Similar to the Cedar River, the Shell Rock River
trend analysis of three key water pollutants (phosphorus, nitrate-nitrogen, and suspended
sediment) shows no significant change as well.
While no nitrate trend was detected, the average nitrate concentrations in the Cedar Watershed are
among the highest in the state. This may be due to changing cropping practices, expanded
agricultural drainage, and climate change. See Figure 5.
Given climate change and potential land use changes, the lack of a trend for nitrates, phosphorus,
and sediment might be viewed as a positive and the result of coordinated state and local watershed
management efforts, including changes to some agricultural practices.
Average annual streamflow has increased dramatically in the Cedar River Watershed (Figure 8).
Increased streamflow has implications for stream channel conditions, property and safety, and
pollutant loading. Increased streamflow results in increased channel erosion and sediment
deposition, which can degrade habitat for fish and other aquatic life. Flooding threatens the property
and safety of watershed residents. More water means larger pollutant loads and increased chances
of downstream flooding. While increasing precipitation is certainly an important factor in the
streamflow increase, expanding agricultural drainage and land use changes are also important. In
recent years, there has been a significant effort to reduce flows coming from the Dobbins Creek
Subwatershed. BMPs strategically placed throughout the Dobbin’s Creek Subwatershed are expected
to reduce peak flows by 10% during a 100-year, 24-hour event at the outlet site.
Similar to the Cedar River, average annual flow volume at the Shell Rock River outlet site (Figure 9)
has shown increases since 2008. These increases are also tied to increasing rainfall amounts,
increased agriculture drainage, and land use changes. The apparent increase over the relatively short
period (12 years) depicted on this graph is largely driven by the very wet years of 2016, 2018, and
0
200
400
600
800
1000
1945
1950
1955
1960
1965
1970
1975
1980
1985
1990
1995
2000
2005
2010
2015
2020
Cedar River Average Annual Flow 1945-2020
(cubic feet per second)
Average annual mean flows have
more than tripled since 1945
Figure 8. Cedar River annual flow (CFS).

12
June 2022 | wq-ws3-0708201c
2019. The years 2020 and 2021 were much drier and flows (when data is finalized) will likely be
lower. It is worth noting that for rivers in southern Minnesota with long-term records, flows have
increased substantially. This includes the Cedar River, where average annual flows have tripled over
the past 75 years.
Figure 9. Shell Rock River annual flow (CFS).
Biological communities
Paired t-tests of fish and macroinvertebrate IBI scores were used to evaluate if biological condition of
the watershed’s rivers and streams has changed between time periods. Independent tests were
performed on each community with 31 sites evaluated for both macroinvertebrates and fish (i.e.,
sites that were sampled in both time periods). The average macroinvertebrate IBI score for the Cedar
Basin decreased by 0.9 points between 2009/2015 and 2019, which does not represent a statistically
significant change. Similarly, the average fish IBI scores across the four watersheds increased by 3.6
points, which was also not statistically significant. Fish IBI scores increased at 16 of the stations and
decreased at 14 of the stations, with the remainder of the stations showing no change in fish IBI
scores. A similar change analysis was not completed for lakes because comparable fish community
data had not been collected during initial monitoring efforts.
Context for the change analysis results is provided by a characterization of the conditions under
which biological monitoring occurred in Cycle 1 and Cycle 2. For the five years prior to sampling in
2009, the Cedar Basin watersheds had experienced a decreasing precipitation trend, which
continued for three more years. Conversely, sampling conditions in 2019 took place after five years
of average to above-average flow conditions. Long- and short-term precipitation cycles are directly
related to flow conditions and can have a significant impact on biological communities. Long-term
dry conditions, like those that occurred in 2009, can result in low flow conditions that are stressful
to biological communities. Despite the low flow conditions in 2009, a nearly complete set of
watershed samples was collected, allowing for a robust comparison between sampling periods. The
persistent average to above-average flow conditions preceding the 2019 sampling collection
resulted in optimal sampling conditions. The stable flows associated with persistent average to
above-average precipitation often result in healthier biological communities, but if flows become
too high, sampling conditions can be impacted, and community health scores can be negatively
impacted. Given the difference in flow conditions between our two sampling periods, we would
expect to see a slight increase in biological health, and this was the case with the fish community.
0
100
200
300
400
2008 2009 2010 2011 2012 2013 2014 2015 2016 2017 2018 2019
Shell Rock River at Gordonsville Average Annual
Flow 2008-2019 (cubic feet per second)

13
June 2022 | wq-ws3-0708201c
The health of the invertebrate community between Cycle 1 and Cycle 2 was nearly identical, with a
very slight downward trend, which suggests that overall, the low flows experienced in 2009 had a
negligible impact on invertebrate health.
Clarity
The Cedar River Basin has 16 lakes with some level of transparency data. Trend analysis was
conducted on seven lakes that met data requirements (50 Secchi measurements, eight years of
data). Like statewide results, most lakes do not exhibit a significant change, and more lakes have
improving clarity than declining. White Lake (Shell Rock River Watershed) had increasing clarity,
while the rest of the lakes analyzed showed no trend. None of the lakes analyzed had declining
clarity. Much of the data needed to determine these trends comes from scientist volunteers
through the Volunteer Water Monitoring Program.
The Cedar River Basin has 75 stream stations that have some level of transparency data, measured
with a Secchi tube. Trend analysis was conducted on 15 stream stations that met data
requirements. A Tobit regression model, which detects changes in water clarity over time by
comparing months across years (Mays are compared to Mays, Junes to Junes, etc.) was used for
the analysis. This test also accounts for the limit of the Secchi tube to detect water clarity of 100
centimeters or less. Stream water clarity must change at least 2 cm per decade to be considered a
detectable change, or trend.
Degrading clarity was observed at seven of the stations. Improving clarity was observed at three
stations. The remaining five stations showed no trend. Multiple stations may exist on an individual
stream reach, and different results at monitoring stations along an individual reach are possible
and reflect the variability present in stream systems.
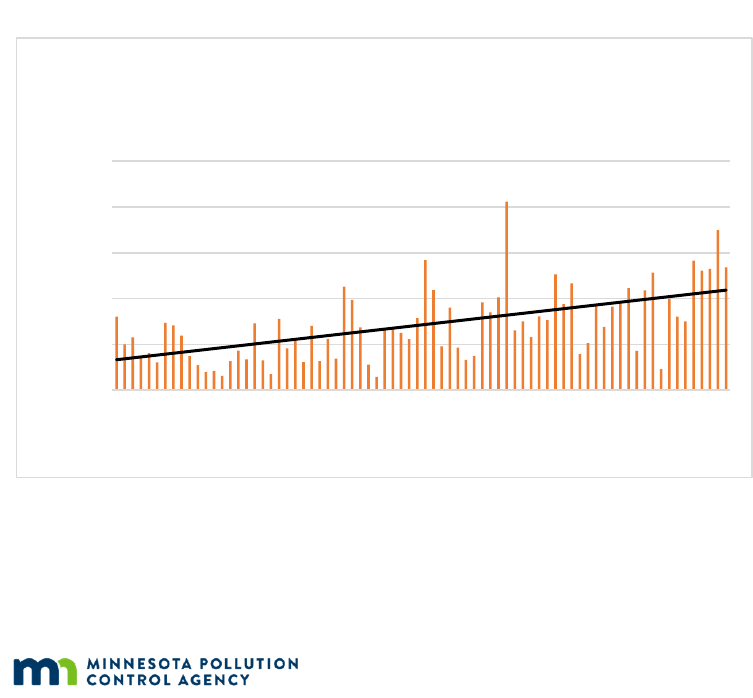
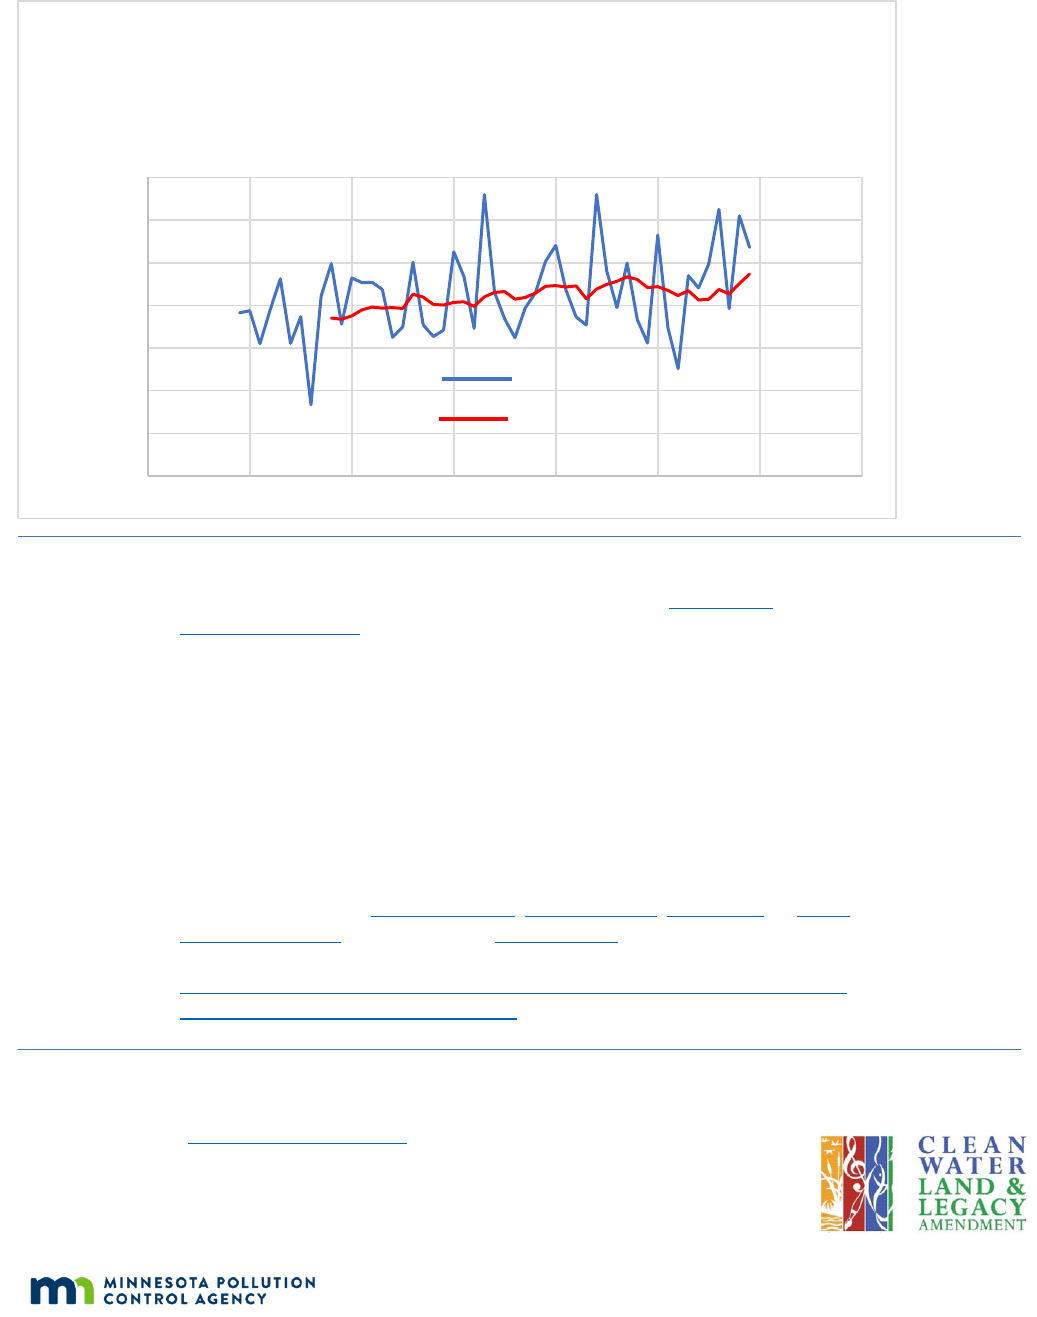
Climate
The Cedar Basin Watersheds now receives on average 3.3 to 3.6 additional inches of rain per year
when compared to the historical average (1895-2018). Furthermore, climate scientists suggest that
precipitation events are becoming more intense. In addition, the average annual temperatures in
the watersheds have increased by 0.7 to 0.9 degrees Fahrenheit (F) per year, while average annual
winter temperatures have increased by 1.8 to 2.1
o
F. Increased rainfall and temperature can worsen
existing water quality problems. More precipitation and reduced snow cover can increase soil
erosion, pollutant runoff, and streamflow. Increased streamflow in turn can lead to stream channel
erosion and degraded habitat for fish and other aquatic life. Longer growing seasons with higher
temperatures can lead to more algal blooms. These changes will complicate efforts to protect and
restore the watersheds. For more information on Climate and watersheds, navigate to
MN DNR
Climate Summaries.
14
June 2022 | wq-ws3-0708201c
Figure 10. Characterization of rainfall conditions for May-September period (1969-2019) for the Cedar River
Watershed.
This study of the Cedar River, Shell Rock River, Winnebago River, and
Wapsipinicon River Watersheds was conducted as part of
Minnesota’s
Watershed Approach to restoring and protecting water quality. Efforts to
monitor, assess, study, and restore impaired waters, and to protect healthy
waters are funded by Minnesota’s Clean Water, Land, and Legacy Amendment.
Stressor identification for new impairments and updates to the Watershed
Restoration and Protection Strategy follow the completion of monitoring and
assessment. This approach allows for efficient and effective use of public
resources in addressing water quality challenges across the state. The data and
assessments produced by this study can inform local efforts to restore and
protect waters in these watersheds, such as the One Watershed, One Plan
document, a comprehensive watershed management plan that targets projects
to protect and restore the watershed’s most valuable resources. For more
information, go to the
Winnebago River, Shell Rock River, Cedar River, or Upper
Wapsipinicon River webpages on the MPCA website. And for more specific
assessment data, go to the Tableau workbook:
https://public.tableau.com/app/profile/mpca.data.services/viz/WaterQualityAs
sessmentResultsDataViewer/HomePage.
Dan Fettig
Minnesota Pollution Control Agency
651-757-2542
0
5
10
15
20
25
30
35
1960 1970 1980 1990 2000 2010 2020 2030
Precipitation (inches)
Year
May-Sept Precipitation, 1969-2019
Preciptiation
10 year moving average
For more
information
Contact
